Application Note
Zaptron Systems, Inc.
Financial
Investment Portfolio Analysis
Goal:
Increase investment portfolio.
Objective:
Build a reliable mode from stock market data and use the model to discriminate
good companies from bad ones.
Method:
Data of 800 public companies traded on a stock market were collected.
Dead-zone method was used to select data from 56 good and bad companies. After feature
selection, a mathematical model was built as the discrimination function.
Target:
INC% - profile increase rate that is the overall criterion to evaluate a company's performance in
the stock market.
Six Factors to Evaluate a
Company
 |
CO - comprehensive economic
index (liquidability, debt…) |
|
S - market return rate =
profit/share = price/earning (e.g., 20/0.5 = 40) |
|
In%- annual increase rate of earning
{E(k)/E(k-1)} |
|
J% - return rate on net asset (e.g. 33.3% for
Zaptron) = (earning per share) / {(net
asset/total share)} |
|
M% - (profit per share)/{net
asset/total shares} |
|
Jb - { stock price / (net asset/total share) }, 1.0~2.0 is best |
Result:
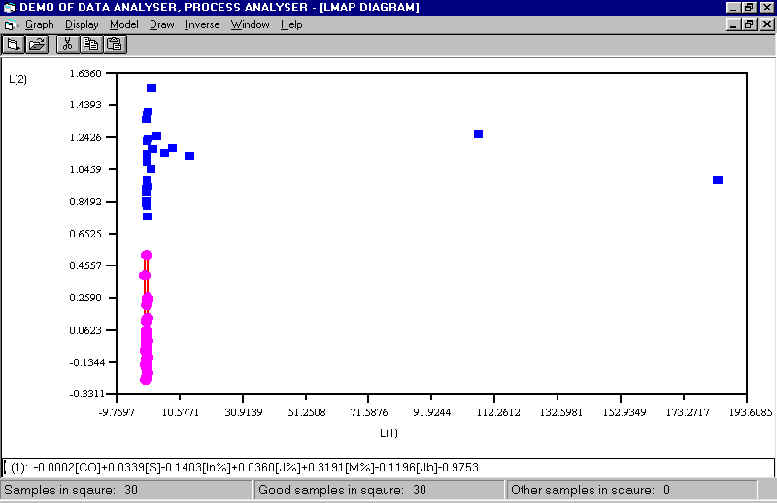
This was a highly non-linear problem, linear discrimination methods,
including PCA and Fisher, failed to separate the data points of good companies from those
of bad companies. Zaptron's MasterMiner toolkit offered a good solution to a mathematical
model by separating these two types of data into two clusters in a 2-dimensional subspace
(see picture below). The red points in this picture represent data of good companies,
while the blue points of bad companies. Accidently, the data of two companies
showed up on the boundary between the two clusters, verifying the fact that they had
recently been acquired by other companies.
© Copyright,
1998-2000, Zaptron Systems, Inc. Back to Home.